A B Testing
Understanding the data, and the problem
df = pd.read_csv('ab_data.csv')
df.head()
| user_ID | timestamp | group | landing_page | converted |
|---|---|---|---|---|
| 851104 | 2017-01-21 22:11:48.556739 | control | old_page | 0 |
- Analysing the results data from a previously implemented of an a/b test.
-
The extact experiment design is unknown, but one can make assumptions based on results.
- Five columns: user_id, timestamp, group, landing_parge, converted
where:
- timestamp is the datetime user clicked on call-to-action
- user_id is the id assigned to user based on account id
- group states the two different treatment groups the user was assigned to {treatment,control}
- landing_page is the variable that is different between the different groups and ultimately the two user experiences
- The A variant is the old_page
- B variant is the new_page
- flag determining whether user clicked on call-to-action
- 1: yes
- 0: no
In a real-world scenario, the experiment would be designed, executed , and then results analysed. However we already have the results, we will be working backwards for learning purposes.
Example Scenerio :
The current conversion rate is 13% on average throughout the year for the old_page (variant A) this is our baseline conversion rate. The product manager says aim for 2% uplift, if converstion rate is 15% new product will be launched.
Designing experiment
As conversion rate is a binary metric 1 or 0, a two sample z-test on population proportion can be used. The statistics are straight forward.Dont need to bootstrap is construct confidence intervals
As the randomisation unit of the experiment was at page-level, I assume the analysis unit of the conversion rate is also at page-level due to the independence assumption between units.
conversion rate = sum(converted)/number of pageviews
- Null hpothesis : the conversion rate of the old and new design are the same
- Alternative hypothesis : the conversion rates are different
Power analysis is conducted to calculate to minimum effective size to measure our 2% uplift
statistical Power of the test - This represents the probability of finding a statistical difference between the groups in our test when a difference is actually present. commonly 0.8 is used alpha = 0.05 is commonly used , with (1-alpha) confidence level of 95% minimum Effect size - delta of 2%, we can calculate programatically using 13% (lower) and 15% (upper) bounds
import statsmodels.stats.api as sms

# Calculating effect size based on our expected rates
effect_size = sms.proportion_effectsize(0.13, 0.15)


required_n = sms.NormalIndPower().solve_power(
    effect_size,
    power=0.8,
    alpha=0.05,
    ratio=1
    )


required_n = ceil(required_n)
print(required_n)
#4720
Have to round up n to next whole number (cant have half a pageview)
ratio parameter is the SRM ratio which should be 1 for 50/50 univariate experiments
random sample size of 4720 for each treatment need to be assigned
ratio is the SRM ratio which should be 1 for 50/50 univariate experiments random sample size of 4720 for each treatment need to assigned
pd.crosstab(df['group'], df['landing_page'])
| frequency | new_page | old_page |
|---|---|---|
| control | 1928 | 145274 |
| treatment | 145311 | 1965 |
Validity of Results
the control group must only see the old page, the treatment group only the new page, this needs to be investigated with the software engineers. As our independence assumption between units will invalidate our results. However for this excresie we continue. A cause can be from caching on client side … will need to debug
page_views = df['user_id'].value_counts(ascending=False)
users = page_views[page_views > 1].count()

users_to_drop = page_views[page_views > 1].index

df = df[~df['user_id'].isin(users_to_drop)]
There were 3894 users that experienced both user-experiences The updated dataset now has 286690 entries
Statistics
control_sample = df[df['group'] == 'control'].sample(n=required_n, random_state=22)
treatment_sample = df[df['group'] == 'treatment'].sample(n=required_n, random_state=22)

ab_test = pd.concat([control_sample, treatment_sample], axis=0)
ab_test.reset_index(drop=True, inplace=True)

n_con = control_results.count()
n_treat = treatment_results.count()
successes = [control_results.sum(), treatment_results.sum()]
nobs = [n_con, n_treat]

z_stat, pval = proportions_ztest(successes, nobs=nobs)
(lower_con, lower_treat), (upper_con, upper_treat) = proportion_confint(successes, nobs=nobs, alpha=0.05)
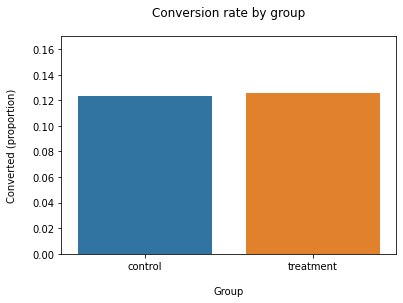
- z statistic: -0.34
- p-value: 0.732
- ci 95% for control group: [0.114, 0.133]
- ci 95% for treatment group: [0.116, 0.135]
Fail to reject null, p-value > alpha. Probability of seeing a extreme result greater than type 1 error.
Also the confidence interval for the treatment group ([0.116, 0.135], i.e. 11.6-13.5%) we notice that:
- It includes our baseline value of 13% conversion rate
- It does not include our target value of 15% (the 2% uplift we were aiming for)
No strong evidence to reject null